Why We're Building India's largest AI Cluster
In the race to AGI, compute is destiny. Nations with massive GPU clusters will lead the intelligence explosion, while others become permanent consumers. India's window to act is closing fast.
🧠 The Intelligence Revolution Timeline

Key Insight
The jump from current AI to AGI happens in years, not decades. Infrastructure built today will capture a century of value in the next 5 years.

The Compute Arms Race
Computing power requirements are exploding exponentially. The gap between leaders and followers widens by 10x every year. Act now or be left behind forever.
⚡ The Global Infrastructure Race
The world's superpowers are committing trillions to AI infrastructure. Every month of delay means falling further behind in the intelligence explosion.
every 2 years
by 2030
by 2030
gap ratio
📊 Compute Scaling Trajectory
The exponential growth in training compute shows the path from current models to AGI and beyond. Each generation requires 100x more compute than the last.
Source: Romeo Dean, April 2025
💻 The Exponential Leap in Compute Scale
Visualizing the massive difference in computational requirements across AI model generations
Each square represents equal computational power
Compute is the New Oil
The intelligence explosion is compute-bound. GPUs are the bottleneck between current AI and AGI. Owning 500MW of sovereign compute infrastructure positions us at the epicenter of the $10 trillion value creation event coming in the next 5 years.
Trillion-Dollar CapEx Race
Global leaders are planning $100B+ clusters, heading toward $1T by 2030. Microsoft, Google, and Meta are each building 5GW+ facilities. Demand vastly outstrips supply. Early movers capture 50-100x returns.
India's Cost & Energy Edge
Direct-to-chip liquid cooling + Uttarakhand hydropower + campus PUE < 1.1 delivers 40-50% lower TCO than US/EU. Our $0.08/kWh renewable power and 67% lower labor costs create an unbeatable economic moat.
Sovereign AI Infrastructure
India cannot depend on foreign clouds for defense AI, government services, or critical research. Antriksh provides the trusted, sovereign infrastructure that keeps Indian data and AI capabilities under Indian control.
Exponential Returns Flywheel
Compute leases + enterprise contracts + equity-for-compute ventures create compounding returns. As AI capabilities explode, our infrastructure becomes exponentially more valuable. Think AWS in 2010, but for the AGI era.
India's Once-in-History Opportunity
The nation that controls AI infrastructure controls the future. India has 24 months to secure its position or face permanent technological colonization.
India: Maximum Demand, Minimum Supply
💡 Key Insight: India has 2.2x higher AI adoption than the USA but 51x less infrastructure. With 1.4 billion people embracing AI, this gap represents the world's largest untapped AI market.
Maximum Demand Meets Minimum Supply
India's 48% AI adoption rate (world's highest) combined with just 1MW/million users infrastructure (world's lowest among major economies) creates an unprecedented $41.7B market opportunity. Antriksh's 500MW facility will provide 40% of India's total AI compute capacity, capturing this massive gap.
❌ The Cost of Inaction
- • Permanent dependence on US/China AI systems
- • Loss of data and AI sovereignty
- • Exclusion from $10T AGI value creation
- • 1.4 billion Indians become AI consumers, not creators
- • Economic colonization through AI monopolies
✅ The Prize for Action
- • Lead the Global South in AI revolution
- • Create $1 trillion AI economy by 2047
- • Secure technological sovereignty forever
- • Enable 10,000+ Indian AI unicorns
- • Position as trusted AI partner for democratic nations
🏗️ Antriksh: From Vision to Execution
While others debate, we execute. Here's what we've already achieved:
🎯 Government Partnership
- ✓ 500MW in-principle approval secured - industry first
- ✓ MoU finalizing with lucrative state incentives
- ✓ Fast-track environmental & land-use clearances
- ✓ Single-window coordination for all utilities
- ✓ Capital subsidies & SEZ tax exemptions
⚡ Infrastructure Ready
- ✓ 14 sites evaluated, optimal location secured
- ✓ Direct canal water access for liquid cooling
- ✓ Multiple 100Gbps fiber carriers within 5km
- ✓ Greenfield land for 3MW→100MW→500MW phases
- ✓ Adjacent to substations & transport corridors
🚀 Technology Excellence
- ✓ CDAC & NSM design validation completed
- ✓ PUE ~1.10 with zero-liquid-discharge cooling
- ✓ 99.99% uptime Tier 4 standards targeted
- ✓ ≥50% renewable hydropower commitment
- ✓ 150+ kW/rack density for latest GPUs
🌍 Global Positioning
- ✓ US GPU export restrictions lifted - perfect timing
- ✓ Silicon Valley office for tech partnerships
- ✓ By-invitation approach via IIT/TiE/Valley networks
- ✓ Strategic anchor customers in pipeline
- ✓ 3 UHNIs committed, institutional round preparing
📋 Investment Highlights at a Glance
- ✓ Phased Execution: 3MW PoC → 100MW → 500MW risk-mitigated approach
- ✓ AI Campus Vision: On-site incubator + R&D labs + workforce programs
- ✓ ESG Leadership: ≥50% renewable power + zero-liquid-discharge
- ✓ Immediate Traction: Potential anchor customer + UHNI investors visiting site
⏰ The 24-Month Window
The race to AGI infrastructure is happening NOW. Every month of delay is a permanent setback.
2025-2027: Decision Window
Global powers are committing $1T+ to AI infrastructure. Saudi Arabia allocates $600B. UAE targets 500,000 GPUs. China builds despite sanctions. India must act NOW.
2030-2035: Capability Divide
Nations with infrastructure train sovereign AGI models. Those without become permanent consumers. The technological hierarchy gets locked in forever.
2035-2040: New World Order
AGI transforms into ASI. Economic and military supremacy flows to AI-sovereign nations. The infrastructure built today determines prosperity for centuries.
⚡ Why 500MW Changes Everything
This isn't incremental progress. It's a quantum leap that positions India among the global AI superpowers overnight.
Impact at Scale
500MW represents a 40% increase in India's total data center capacity, specifically dedicated to AI. This single facility will provide more AI compute than all existing Indian data centers combined, finally matching India's 48% AI adoption rate with world-class infrastructure.
Now Is the Time to Invest
Antriksh stands at the convergence of government momentum, technical readiness,
ecosystem support, and perfect market timing. The AGI race has begun.
Join us in building India's sovereign AI infrastructure.
Help define the future of AI for 1.4 billion people.
The time is now. The opportunity is massive. The future is compute.
📈 AI Compute Market Sizing & Opportunity
📈 Market Growth CAGR above 32%
🎯 TAM / SAM / SOM Funnel (2025)
📊 AI-GPU Compute Demand Growth (2022-2030)
🇮🇳 India's Infrastructure Gap: The Opportunity
🚨 DC Capacity vs Data Consumption Mismatch
💡 Key Market Insights & Growth Drivers
🌍 Global Market Projections
- Global AI market projected to reach $3.68 trillion by 2034 with 19.2% CAGR
- AI chips/GPU market expected to reach $92B by 2025
- Global GPU-as-a-Service market to grow at 28.78% CAGR to $28.7B by 2030
- Data center capacity demand to grow 19-22% annually through 2030
🇮🇳 India's Growth Drivers
- Digital transformation & 5G deployment driving data demand
- Infrastructure status granted to DC sector (Draft Data Centre Policy 2020)
- India's data center market to add 987+ MW capacity by 2026
- Government allocated ₹10,732 crore ($1.24B) for AI infrastructure
- DC capacity grew from 350 MW (2019) to 854 MW (2023)
⚡ Infrastructure Requirements
- India needs additional 40-45 TWh of power by 2030 for AI growth
- Average data center power densities doubled: 8kW → 17kW per rack
- AI-ready data centers expected to reach 30kW per rack by 2027
- Despite generating 20% of global data, India has only 3% DC capacity
AI Risk & Reward Matrix
Comprehensive Analysis of the AI Value Chain Ecosystem
AI GPU Data Centers have the best RoI Performance
Optimal Risk-Reward Position: Unlike pure-play semiconductor companies (higher risk) or general cloud providers (lower specialization), we combine infrastructure stability with AI-specific expertise and premium pricing power from GPU scarcity.
Multi-Factor Performance Analysis
GPU Data Centers excel across key investment criteria
• Data based on Koncentrik market analysis
📊 The GPU Data Center Investment Thesis
Revenue Model Advantages
- Recurring Revenue: Monthly/annual contracts vs one-time sales
- High Margins: 60-70% gross margins at scale
- Pricing Power: Supply-demand imbalance favors providers
- Network Effects: Ecosystem attracts more customers
Risk Mitigation Factors
- Diversified Client Base: Not dependent on single customers
- Essential Service: AI compute is mission-critical
- Capital Efficiency: Shared infrastructure model
- Proven Demand: Waitlists for GPU capacity
Market Timing
- Early Stage: AI adoption still <10% of potential
- Regulatory Tailwinds: Government AI initiatives
- Technology Inflection: GPT moment driving demand
- Capital Scarcity: Limited competition due to high barriers
AI Growth Across Every Modality and Industry
Large Language Models
- • Natural language understanding & generation
- • Code generation (46% of code AI-written)
- • Reasoning & problem-solving
- • Context windows up to 1M+ tokens
- Finance: Risk analysis, trading, compliance (37% productivity gain)
- Healthcare: Clinical documentation, diagnosis assistance (4 hrs/day saved)
- Legal: Contract analysis, research (85% faster review)
- Education: Personalized tutoring, content creation
- Customer Service: 24/7 support, 90% query resolution
Computer Vision
- • Object detection & segmentation (99.5% accuracy)
- • Real-time video analysis (60+ FPS)
- • 3D scene understanding
- • Facial recognition & emotion detection
- Manufacturing: Defect detection (95% reduction), quality control
- Retail: Checkout-free stores, inventory management ($1.6T impact)
- Healthcare: Medical imaging, disease detection (40% faster diagnosis)
- Automotive: Autonomous driving, ADAS systems
- Agriculture: Crop monitoring, yield prediction (30% increase)
Scientific AI
- • Protein structure prediction (90% accuracy)
- • Molecular simulation & drug design
- • Materials discovery (800x faster)
- • Climate & weather modeling
- Pharmaceuticals: Drug discovery 10x faster, $100B+ savings
- Materials Science: 2.2M new materials discovered
- Energy: Battery efficiency +40%, solar cell optimization
- Climate Tech: Carbon capture, weather prediction (14-day accuracy)
- Biotechnology: Gene editing, synthetic biology design
Embodied AI & Robotics
- • Human-like dexterity (95% task success)
- • Natural language instruction following
- • Real-time environment adaptation
- • Collaborative human-robot interaction
- Manufacturing: Assembly lines (50% productivity increase)
- Logistics: Warehouse automation, last-mile delivery ($290B market)
- Healthcare: Surgery assistance, elderly care (30% staff augmentation)
- Construction: Automated building, dangerous task handling
- Agriculture: Harvesting, planting (24/7 operation)
Multimodal AI
- • Unified text, image, audio, video understanding
- • Cross-modal reasoning & generation
- • Real-time multimodal interaction
- • Context preservation across modalities
- Media & Entertainment: Content creation, real-time translation
- Education: Immersive learning, intelligent tutoring (3x retention)
- Healthcare: Holistic patient analysis, telemedicine enhancement
- E-commerce: Virtual try-ons, product search (45% conversion increase)
- Security: Comprehensive threat detection, behavior analysis
Video Generation
- • Text-to-video generation (4K, 60fps)
- • Scene consistency & temporal coherence
- • Character animation & lip-sync
- • Real-time video editing & effects
- Entertainment: Film production costs -95%, democratized creation
- Advertising: Personalized ads, A/B testing at scale ($150B impact)
- Education: Interactive content, visual learning (85% engagement)
- Gaming: Dynamic cutscenes, procedural content generation
- Real Estate: Virtual property tours, architectural visualization
Audio & Voice AI
- • Real-time voice cloning (99% accuracy)
- • Music generation from text
- • Universal language translation
- • Emotion & sentiment analysis
- Music Industry: AI-composed music, personalized soundtracks ($12B)
- Call Centers: Voice agents, 80% call handling automation
- Entertainment: Dubbing, voice acting, podcast generation
- Healthcare: Voice biomarkers, speech therapy (early disease detection)
- Accessibility: Real-time translation, hearing assistance
Code Generation
- • Full application generation from prompts
- • Bug detection & automatic fixing
- • Code review & optimization
- • Multi-language translation
- Software Development: 46% of code AI-generated, 10x faster deployment
- FinTech: Automated trading systems, compliance code
- Gaming: Procedural game logic, AI-powered NPCs
- Enterprise IT: Legacy code modernization, API generation
- Startups: MVP development in days vs months
3D Generation
- • Text-to-3D model generation
- • Photorealistic texturing
- • Animation & rigging automation
- • VR/AR asset creation
- Gaming: Asset creation 100x faster, procedural worlds
- Architecture: Instant 3D visualization, VR walkthroughs
- E-commerce: 3D product models, AR try-before-buy (70% returns reduction)
- Manufacturing: Rapid prototyping, digital twins
- Metaverse: Content creation democratized, virtual worlds
AI Modalities Investment Comparison
| Modality | 2024 Market | 2035 Market | CAGR | Key Investment Driver | Leading Companies |
|---|---|---|---|---|---|
| Large Language Models | $6.4B | $1T+ | 79.8% | Enterprise adoption inflection |
Global: OpenAI, Anthropic, Google, Meta India: Sarvam AI, Krutrim, Tech Mahindra |
| Scientific AI | $20.9B | $520B | 48.1% | Drug discovery revolution |
Global: DeepMind, Atomwise, BenevolentAI India: Nference, Zuventus, Innoplexus |
| Robotics | $3.28B | $187B | 45.5% | Labor shortage solution |
Global: Tesla, Boston Dynamics, Figure, Agility India: GreyOrange, Systemantics, Addverb |
| Video Generation | $1.5B | $156B | 42% | Content creation disruption |
Global: OpenAI (Sora), Runway, Pika Labs, Stability AI India: Rephrase.ai, Fliki, Steve.ai |
| Multimodal AI | $3.29B | $93.99B | 36-40% | Platform consolidation |
Global: OpenAI GPT-4V, Google Gemini, Anthropic Claude India: Haptik, Yellow.ai, CoRover |
| Voice AI | $4.8B | $85B | 32.51% | Interface revolution |
Global: ElevenLabs, OpenAI Whisper, Deepgram India: Gnani.ai, Uniphore, Speech Qube |
| Computer Vision | $26.55B | $473.98B | 29.95% | Mature technology scaling |
Global: NVIDIA, Amazon Rekognition, Microsoft Azure CV India: Uncanny Vision, Mad Street Den, Netradyne |
| 3D Generation | $0.32B | $2.8B | 22% | Metaverse enablement |
Global: NVIDIA GET3D, Meta 3D Gen, Kaedim India: Avataar, Scapic, Merxius |
Key Investment Insights
🚀 Highest Growth
🌏 India's Opportunity
💡 Best Balance
The Intelligence Revolution Timeline
PhD-Level AI & Foundation Phase
AI matches human expert performance. LLM applications explode.
India: 48% AI adoption drives massive demand
AI Researchers & Acceleration
AI begins improving itself exponentially. Multimodal AI emerges.
Antriksh: 500MW infrastructure operational
AGI Emergence
Human-level general intelligence achieved. $1T market crossed.
India: Becomes global AI powerhouse
Superintelligence Era
AI capabilities beyond human comprehension. $5.3T market.
Impact: Every industry transformed
The AI Intelligence Explosion
We are witnessing the greatest technological transformation in human history. The AI market is exploding from $279B to $5.3T by 2035, and India stands at the epicenter of this revolution with the world's highest AI adoption rate.
3MW Phase 1 PoC Investment Opportunity
Building India's AI Infrastructure Leader with Progressive Milestone-Based Funding
Assuing PuE of 1.7 for the PoC, 3MW / 1.7 = 1.76 MW of GPU IT Load (~ 24 Racks of Blackwell GB200 NVL72)
Progressive Capital Deployment Structure
Detailed 3MW PoC Milestones
Tranche 1: Regulatory & Site Validation
🏛️ Government & Regulatory
- Execute final MoU with state government
- Obtain environmental & pollution clearances
- Secure fire safety NOC
📍 Site & Infrastructure
- Execute land lease agreement
- Complete soil testing & geotechnical survey
- Finalize container layout design
- Obtain construction permits
⚡ Power & Supply Chain
- Secure power allocation
- Sign fiber connectivity agreement (1.6Tbps)
- Execute NVIDIA partner agreement
- Confirm GB200 allocation (1,728 units)
Tranche 2: 3MW Infrastructure Build
🏗️ Civil & Construction
- Complete site grading & compaction
- Build container pad foundations
- Construct access roads & security fencing
- Install drainage & fire suppression systems
🔌 Power Infrastructure
- Comission electrical substation
- Install transformers & switchgear
- Deploy UPS systems & backup generators
- Complete electrical testing & commissioning
📦 Container & Commercial
- Deploy 3x 1MW container shells
- Install internal racking systems
- Complete liquid cooling piping (dry)
- Sign 3+ anchor customers ($15M+ contracts)
Tranche 3: Go-Live & Revenue Generation
🖥️ GPU Deployment
- Procure 1,728 NVIDIA GB200 GPUs
- Complete rack integration & cabling
- Deploy 400Gbps network fabric
- Install GPU monitoring systems
❄️ Cooling & Operations
- Fill & commission liquid cooling system
- Optimize CDU performance (150kW/rack)
- Achieve PUE < 1.10
- Complete 24/7 operations setup
💻 Platform & Revenue
- Launch cloud orchestration platform
- Deploy billing & provisioning systems
- Achieve first customer go-live
- Reach $1M+ monthly recurring revenue
- Secure Series A for 100MW expansion
3MW PoC Success Metrics
Technical Excellence
- 150kW+ rack density
- PUE < 1.10
- 99.99% uptime
Commercial Success
- 85% utilization
- $1M+ MRR
- 3+ anchor customers
Strategic Milestones
- Series A secured
- 100MW site ready
- Team scaled to 50+
Execution Timeline
- Revenue in 6 months
- Proven in 8 months
- Scale-ready in 12 months
Venture Compute Incubation
- 5+ AI startups onboarded
- 10% GPU compute allocated
- $2M+ equity value created
Join Us in Building India's AI Future
Limited allocation available for strategic investors who share our vision of sovereign AI infrastructure
AI Infrastructure Investment Opportunity
Investment Opportunities in the Intelligence Explosion | 2025-2040
Building India's largest 500MW GPU data center with a unique dual-engine model combining world-class infrastructure and strategic AI startup investments
💰 Use of Funds ($66M)
- Infrastructure CapEx: PoC 3MW facility
- Land CapEx: 10 year payment plan
- GPU Procurement: GB200
- Power & Cooling: Liquid cooling infrastructure
- Venture Fund:AI startup investments
- Working Capital: Operations & team building
- Debt Structure: 60% debt financing at India rates
Business Model & Revenue Streams
GPU-as-a-Service
Core infrastructure revenue model
- On-demand: $20-25/hour
- Reserved: $12-15/hour
- Spot: $5-8/hour
- 60% of total revenue
Sovereign Cloud
Government & enterprise contracts
- Data sandboxed instances
- Compliance certified
- Long-term contracts
- 25% of total revenue
AI Venture Model
Equity + compute partnerships
- $1M compute credits
- 5-10% equity stake
- Portfolio approach
- 15% of value creation
🎯 Dual-Engine Value Creation
Infrastructure Returns
- 80%+ EBITDA margins at scale
- Predictable recurring revenue
- 15-20% base IRR from operations
- Premium multiples (10-40x revenue)
Venture Upside
- 100+ AI startups in portfolio
- 1-2 unicorns drive 100x returns
- Strategic value from ecosystem
- Exit through secondary sales
Key Success Metrics
80-85%
GPU Target Utilization
60-70%
Break-even Utilization
$50-500K
Customer Acquisition
3-5 years
Customer Contracts
🚀 The Research-to-Unicorn Pipeline
Most venture compute programs start at Seed stage. We start at the research lab.
Research Grants
IIT/NIT Labs
Free compute
Validation
$10-50K compute
Proof of concept
Seed Investment
$250K-1M
5-7% equity
Series A Scale
$2-5M round
Growth support
Unicorn Status
Infrastructure
10-100x returns
By providing free compute grants to researchers, we see innovations 2-3 years before traditional VCs. This early access creates an unparalleled deal flow advantage.
Global Venture Compute Programs: The Complete Landscape
A comprehensive view of how infrastructure providers and VCs are reshaping startup financing through compute
💎 VC-Led GPU Clusters
- a16z Oxygen: 20,000+ H100 GPUs for portfolio at-cost, trading GPU time for equity stakes
- Nat Friedman/Daniel Gross: 4,000 GPU "Andromeda" cluster with below-market rates
- Y Combinator: Dedicated GPU clusters via Google Cloud partnership
- Sequoia Capital: Up to $500K credits through Google partnership
- Index Ventures: Free Oracle GPU cluster access for portfolio
- Microsoft M12: Reserved Azure instances for portfolio companies
- Conviction (Sarah Guo): Smaller GPU pools for select startups
🏢 Cloud Provider Programs
- CoreWeave Accelerator: Credits + discounts, no equity, VC introductions
- Lambda Labs: Volume discounts + 1-click cluster orchestration
- Scaleway (EU): €9,000 credits + NVIDIA partnership for EU startups
- Oracle for Startups: 70% discount + dedicated clusters for VCs
- Northern Data: Free H100 compute for selected startups
- OpenAI Startup Fund: $100M fund + privileged Azure/API access
- NVIDIA Inception: Global program connecting startups to GPU resources
🌏 Emerging Markets & Models
- Voltage Park: Non-profit model at $1.89/hour backed by $500M
- Together AI: $1M investment + $600K compute credits
- IndiaAI Mission: National GPU pool aggregating multiple providers
- Vast.ai: P2P marketplace 3-5x cheaper than traditional
- Exabits: Tokenized GPU ownership with revenue sharing
- Decentralized networks: io.net with 25,000+ nodes on token incentives
💡 Key Insight for Investors
The tight collaboration between infrastructure providers, VCs, and AI giants represents a fundamental shift in how startups are funded and scaled. Unlike past software startups that needed only laptops, today's AI ventures require supercomputing-class hardware from day one. This creates an unprecedented opportunity for infrastructure providers who can also participate in equity upside.
The $10K Validation Gap
Current Reality
- 95% of breakthroughs never validated
- $5-10K blocks proof-of-concept
- 6-month GPU waiting lists
- $3-5/hour rates prohibit testing
- VCs miss pre-validation innovation
- India talent emigrating for compute
- Research grants exclude infrastructure
Antriksh Solution
- Free $10-50K compute grants
- See innovations 2-3 years early
- Convert research to fundable startups
- $1.89-2.49/hour (40-50% savings)
- Instant access to 5,000+ H100s
- Build India's AI ecosystem
- Equity aligns long-term success
Antriksh Cloud's Dual-Engine Strategy
We're not just another infrastructure provider. Antriksh Cloud combines world-class GPU infrastructure with direct equity investment in AI startups, creating a powerful flywheel effect that accelerates both our returns and our portfolio companies' growth.
🏗️ Infrastructure Engine
- ▶ 500MW scalable infrastructure with latest NVIDIA GPUs
- ▶ 40-50% cost advantage vs US/EU providers
- ▶ $750-900M revenue potential at full scale
- ▶ 80%+ EBITDA margins from operational efficiency
- ▶ Predictable, recurring revenue from enterprise contracts
💎 Venture Investment Engine
- ▶ $50-100M venture fund for AI startup investments
- ▶ 5-7 % equity stakes in exchange for compute credits
- ▶ Portfolio synergies driving platform adoption
- ▶ 10-100x potential returns from breakout AI companies
- ▶ Strategic value creation through infrastructure support
The Flywheel Effect
Infrastructure attracts startups → Equity investments create alignment → Portfolio success drives platform growth → Increased scale improves economics → Better terms attract more startups
This virtuous cycle positions Antriksh Cloud to capture value at every stage of the AI revolution
Antriksh Cloud's Unique Approach: Unlike pure infrastructure plays, we combine GPU infrastructure with direct equity investments in AI startups. This dual-engine model creates multiple paths to returns: predictable infrastructure revenues PLUS venture-scale equity upside from our portfolio companies. Most importantly, we bridge the "compute validation gap"—95% of theoretical AI breakthroughs never reach market simply because researchers lack $5-10K in compute to validate their ideas.
📊 Key Data Points & Market Insights
Critical market data and statistics supporting our investment thesis
📊 What is Fuelling the Data Centre Market Growth in India?
Key Insight: India's data centre (DC) market continues to experience robust growth driven by digital transformation, increased internet penetration, policy enablers, rising data consumption, and artificial intelligence (AI) adoption. The surge in data traffic from various sectors, combined with 5G deployment, is fuelling demand for reliable data storage and processing facilities. Infrastructure status granted to the DC sector, along with the Draft Data Centre Policy 2020 and Digital Personal Data Protection Act (DPDPA) in 2023, has created a favorable environment. India's DC capacity has surged to approximately 1,255 MW as of 9M 2024, projected to expand to around 1,600 MW by end of 2024.
Figure 1. A comparison of India's DC growth drivers with global markets
India's DC outreach show significant under penetration when compared to the developed economies
|
🇮🇳
India
|
🇨🇳
China
|
🇺🇸
USA
|
🇪🇺
EU
|
|
|---|---|---|---|---|
|
👥
Internet users (%)
|
63 | 76 | 92 | 90 |
|
📶
Mobile data
(Exabyte / month) |
26 | 26 | 10 | 17 |
|
🖥️
Data centres
(MW / million users) |
1 | 4 | 51 | 12 |
💡 Key Takeaway:
Despite high mobile data consumption (26 EB/month, equal to China), India has only 1MW of data center capacity per million users compared to 51MW in the USA and 12MW in the EU. This massive infrastructure gap, combined with rapid digital transformation and AI adoption, presents an unprecedented growth opportunity for Antriksh Cloud's 500MW facility.
Source: CareEdge Ratings and Industry Report, March 2024; CBRE Research, Q4 2024
🇮🇳 India Dominates Global AI Usage
Key Insight: India leads global AI adoption. Despite largest no. of AI users and 48% adoption rate (2.2x US), India has only 1.3% of global data centers - creating a huge infrastructure gap.
📊 Source Charts: AI Usage by Country
Click any chart to view full size

India leads with 13.5%

India: 22.16% of users

India ranks #2 globally

India: 48% adoption (2.2x US)
ChatGPT Mobile
🥇 #1 Country by Users
Ahead of USA (8.9%) and Indonesia (5.7%)
Perplexity AI
🥈 #2 Country by Users
11.61 million Indian users, second only to Indonesia (24.78%) but ahead of USA (16.22%)
Claude
🥈 #2 Country by Users
India is Claude's second-largest market after USA, part of the 33.13% US-India combined share
Platform Breakdown
| Platform | India's Share | Rank | Users |
|---|---|---|---|
| ChatGPT | 13.5% | 🥇 #1 | 37.8M |
| Perplexity | 22.16% | 🥈 #2 | 11.6M |
| Claude | ~10% | 🥈 #2 | ~2M |
⚠️ The Infrastructure Gap
Demand:
- 50M+ active AI users (#1 globally)
- 48% adoption rate (2.2x US)
- 672M internet users
Supply:
- Only 152 data centers (1.3%)
- 1MW per million users (vs 51MW US)
- 3-5% of hyperscaler investments
💡 Result: 10-15x infrastructure deficit creates unprecedented opportunity
🚀 Investment Thesis
Market Leadership
#1 in ChatGPT, #2 in Perplexity & Claude
Massive TAM
323M potential users needing infrastructure
Supply Gap
10-15x infrastructure deficit vs demand
Sources: Sensor Tower (ChatGPT), Similar Web (Perplexity & Claude), Statista Consumer Insights (AI Adoption), IAMAI 2024
Charts: See embedded visualizations above (click to enlarge)
🛡️ U.S. CLOUD Act: A Threat to India's Digital Sovereignty
Key Insight: The U.S. CLOUD Act allows American authorities to access data stored by U.S. companies anywhere in the world, including India. With 100% of India's cloud market dominated by U.S. firms (AWS 52%, Microsoft 35%, Google 13%), this creates a critical sovereignty risk where Indian citizens', businesses', and even government data can be accessed by foreign authorities without Indian judicial oversight.
Critical Sovereignty Risks
| Stakeholder | Risk | Impact Level |
|---|---|---|
| Indian Citizens | Personal data can be accessed without Indian court approval | CRITICAL |
| Indian Businesses | Trade secrets & IP exposed to foreign surveillance | CRITICAL |
| Government Data | Sensitive state data accessible without diplomatic channels | EXTREME |
Market Control
100%
India's Hyperscaler clouds controlled by U.S. CLOUD Act
Legal Bypass
ZERO
Indian judicial oversight required for U.S. data access
Constitutional Risk
VIOLATED
Right to Privacy (Article 21) compromised
Data at Risk
1.4B
Indians' data potentially accessible
🚀 India's Sovereignty Defense Strategy
- DPDP Act 2023: Empowers blacklisting countries with inadequate data protection
- Sector Localization: RBI mandates all payment data stored only in India
- Sovereign Cloud Push: Investment in domestic data centers like Yotta NM1
- Policy Stance: "We shall never compromise on data sovereignty" - IT Minister
🌍 Global AI Adoption Rates
Key Insight: India leads global AI adoption with 48% of respondents enjoying AI applications like ChatGPT, more than double the U.S. rate of 22%. This massive adoption gap demonstrates India's receptiveness to AI technology and validates our strategic positioning. While Americans remain skeptical, Asian markets - particularly India, China (37%), and South Korea (34%) - are embracing AI at unprecedented rates, creating enormous infrastructure demand.
Share of respondents who like to use AI applications like ChatGPT (in percent)
💡 Strategic Implication:
The stark contrast between Asian and Western AI adoption rates reveals a massive market opportunity. India's 48% adoption rate, combined with its 1.4 billion population, creates unprecedented demand for AI infrastructure. Antriksh Cloud's 500MW facility is strategically positioned to serve the world's most AI-enthusiastic market, while Western markets remain skeptical and underutilized.
12,000-60,000 respondents (18-64 y/o) per country surveyed Apr. 2024 - Mar. 2025
Source: Statista Consumer Insights
💸 India's Digital Colonization: Getting Just 3-5% of Global Cloud Investments
Key Insight: Despite headline-grabbing billion-dollar announcements, India receives only 3-5% of hyperscalers' global infrastructure investments. While AWS commits $100B+ annually worldwide, India gets ~$2B/year. Microsoft's $80B AI infrastructure spend allocates just $3B to India. This reveals India's true priority level: an afterthought market where U.S. giants deploy yesterday's technology while keeping cutting-edge AI infrastructure for their home markets.
India's Share of Global Cloud Investments
| Hyperscaler | Global Investment | India Investment | India's Share |
|---|---|---|---|
| AWS | $100B+ annually | $12.7B by 2030 | ~5% |
| Microsoft Azure | $80B (FY2025) | $3B (2025-26) | ~4% |
| Google Cloud | $75B (2025) | Undisclosed | <5% |
| Oracle | $6.5B Malaysia alone | Undisclosed | ~4% |
| IBM Cloud | 21 global DCs | 1 DC (Chennai) | <1% |
| Alibaba Cloud | $53B (3 years) | EXITED | 0% |
Average India Share
3-5%
Of hyperscalers' global infrastructure spend
Priority Markets
US: 50%+
Home markets get majority investment
AI Infrastructure
DELAYED
Latest GPUs deploy in US first, India later
True Priority
LOW
India = emerging market, not core focus
⚠️ The Uncomfortable Truth
- Marketing vs Reality: Billion-dollar headlines mask that India gets table scraps compared to US/EU markets
- Technology Gap: H100 GPUs and latest AI chips prioritized for US regions; India gets older generation hardware
- Strategic Position: India viewed as "future potential" not current priority - a market to lock in, not invest in
- Revenue Mismatch: India contributes <2% of global cloud revenue but needs same infrastructure as developed markets
📊 Investment Priorities Revealed
- AWS Virginia: $35B by 2040
- AWS Ohio: $10B expansion
- AWS Georgia: $11B campus
- Total: $56B in 3 US states > All of India
- Oracle Malaysia: $6.5B
- Oracle Japan: $8B
- Microsoft's US share: $40B (50% of $80B)
- India's 1.4B people valued less than 30M Malaysians
💡 What This Means for India
India is being digitally colonized: Hyperscalers invest just enough to capture the market and create dependency, but not enough to build true sovereign capability. With 100% foreign cloud control and only 3-5% of global investments, India's digital infrastructure remains at the mercy of US corporate priorities. The solution? Build sovereign AI infrastructure that serves India's interests, not foreign shareholders.
⚡ Global Data Center Critical IT Power (Megawatts - MW)
Key Insight: AI data centers are driving an unprecedented surge in global power demand. While non-AI data center power grows steadily, AI infrastructure power consumption is exploding exponentially - from just 2,000 MW in 2022 to a projected 135,000 MW by 2030. This represents a 67x growth in 8 years. By 2030, AI data centers will consume 65% of total data center power globally, up from just 5% in 2022. This massive power demand creates a critical infrastructure gap that Antriksh Cloud's 500MW facility is positioned to address in the Indian market.
Global Data Center Critical IT Power Projection (2022-2030)
| Year | Non-AI DC Power (MW) | AI DC Power (MW) | Total Power (MW) | AI Share (%) |
|---|---|---|---|---|
| 2022 | 40,000 | 2,000 | 42,000 | 5% |
| 2023 | 45,000 | 5,000 | 50,000 | 10% |
| 2024 | 47,000 | 11,000 | 58,000 | 19% |
| 2025 | 50,000 | 24,000 | 74,000 | 32% |
| 2026 | 55,000 | 40,000 | 95,000 | 42% |
| 2027 | 60,000 | 58,000 | 118,000 | 49% |
| 2028 | 64,000 | 80,000 | 144,000 | 56% |
| 2029* | 68,000 | 105,000 | 173,000 | 61% |
| 2030* | 72,000 | 135,000 | 207,000 | 65% |
💡 Investment Opportunity:
The exponential growth in AI data center power demand creates a massive infrastructure gap. Antriksh Cloud's 500MW facility represents 0.37% of projected 2030 AI data center capacity - a significant contribution to global AI infrastructure. With India's AI adoption at 48% (highest globally), our strategic positioning captures both domestic demand and global overflow from power-constrained markets.
Source: SemiAnalysis Research, 2024 | *2029-2030 projections based on growth trend analysis : https://semianalysis.com/2024/03/13/ai-datacenter-energy-dilemma-race/?utm_source=chatgpt.com#electricity-tariffs-power-mix-and-carbon-intensity
💰 India's Compelling Cost Advantage
Key Insight: India offers unmatched cost advantages for data center operations: construction costs 56% lower, labor costs 67% lower, and power costs at $0.08/kWh compared to $0.12-0.15 in developed markets. Combined with government incentives like 100% tax exemption for 5 years in SEZs, India delivers 40-50% better unit economics than US/EU locations.
| Cost Factor | India | US/Europe | Savings |
|---|---|---|---|
| Construction (per Watt) | $6.60 | $12-15 | 56% |
| Labor (per hour) | $28 | $85 | 67% |
| Power (per kWh) | $0.08 | $0.12-0.15 | 40% |
| Real Estate (per sq ft) | $150 | $400-600 | 70% |
📈 GPU-as-a-Service Market Explosion
Key Insight: The GPU-as-a-Service market is experiencing explosive growth at 34% CAGR, driven by AI workload demands that are growing 4-7x annually. With demand outpacing supply by 3:1, early movers in GPU infrastructure will capture premium pricing and long-term contracts. Our 500MW facility positions us to meet this unprecedented demand.
Market Size
$247B by 2027
Global AI Infrastructure
Growth Rate
34% CAGR
GPU-as-a-Service
Supply Gap
3:1
Demand vs Supply Ratio
Workload Growth
4-7x/year
AI Compute Requirements
🚀 Hyperscaler CapEx Surge
Key Insight: Big Tech companies are investing over $50 billion per quarter in AI infrastructure. As hyperscalers face capacity constraints, they increasingly rely on specialized GPU cloud providers.

🚀 CoreWeave: Startup to $80B Valuation
Key Insight: CoreWeave IPO'd in March 2025 at $23B valuation ($40/share), then surged 300% to $80B ($158-164/share) in just 4 months. Revenue exploded from $16M (2022) to $982M (Q1 2025), backed by $15.9B OpenAI partnership and exclusive Platinum rating.
CoreWeave Revenue Growth 2022-2024

CoreWeave 2025E Revenue - $5B
📈 IPO Performance & Stock Surge
📊 IPO Highlights: CoreWeave raised $1.5B in the largest U.S. tech IPO since 2021, with Nvidia investing $250M as anchor investor. Despite pricing below initial expectations ($40 vs $44-50 target), the stock has tripled in just 4 months, making it the best-performing tech IPO of 2025. Early investors saw returns exceeding 3,400% from the Series C valuation of $19B just 10 months earlier.
Revenue Growth Trajectory
| Year | Revenue | YoY Growth | Key Milestone |
|---|---|---|---|
| 2022 | $16M | — | Pivoted from crypto mining |
| 2023 | $229M | +1,346% | AI boom begins |
| 2024 | $1.92B | +736% | Microsoft = 62% of revenue |
| Q1 2025 | $982M | +420% | IPO March 28 at $23B → Now $80B |
| 2025E | $4.9-5.1B | +163% | Management guidance |
🚀 AI Training Compute Growing 4-5x Annually
Key Insight: Training compute for frontier AI models has grown by 4-5x per year consistently from 2010 to 2024, representing one of the fastest sustained technological growth rates in history. This exponential scaling drives massive infrastructure demand - every 18 months, AI models require 10x more computational power. With today's frontier models at ~5e26 FLOP and projected to reach 2e30 FLOP by 2030 (3,900x increase), the infrastructure gap is widening rapidly. This compute explosion validates Antriksh Cloud's 500MW AI-first facility as essential infrastructure for the AI revolution.
Training Compute of Frontier AI Models (2010-2024)
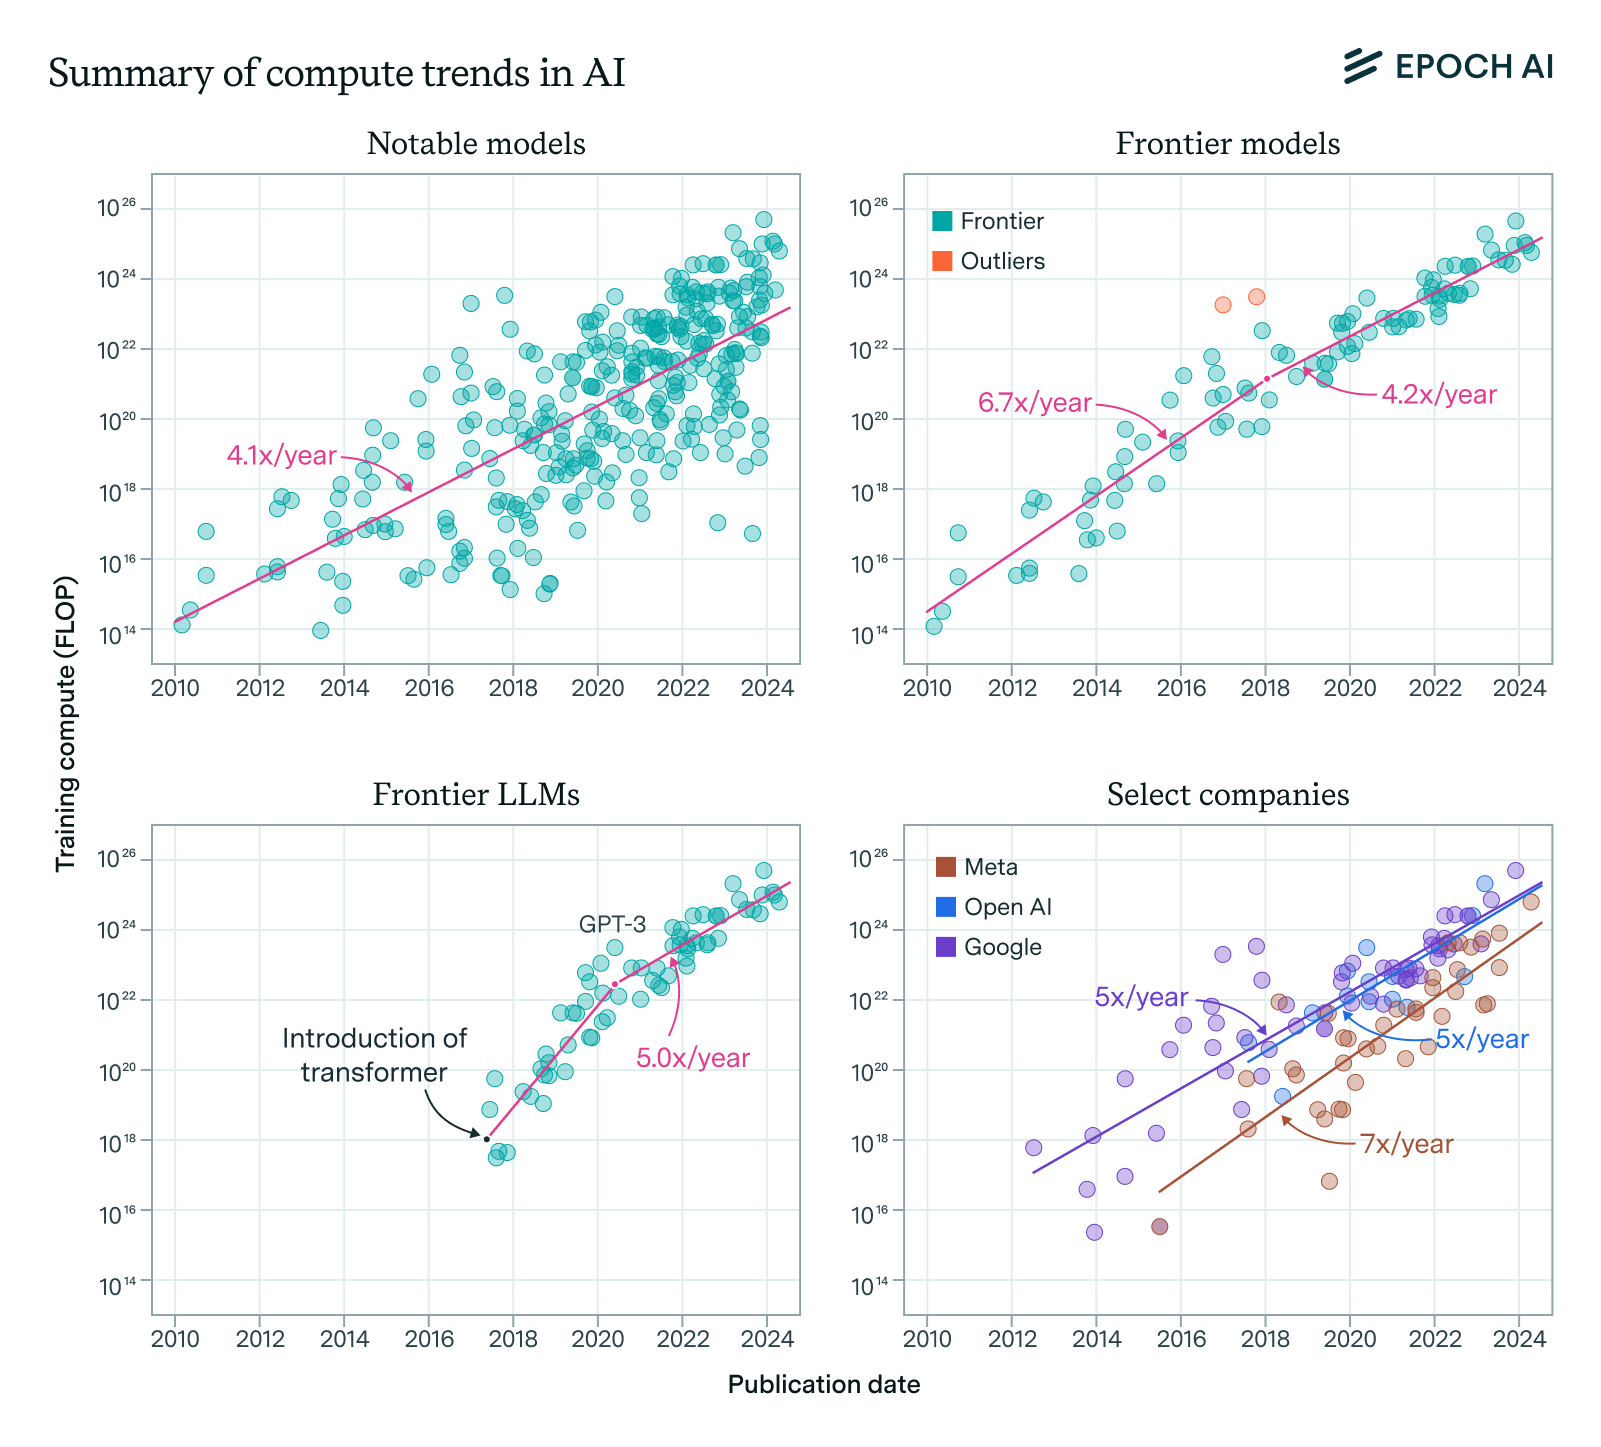
Compute Growth Across Model Categories
| Model Category | Annual Growth | Period | Key Finding |
|---|---|---|---|
| All Notable Models | 4.1x | 2010-2024 | Consistent exponential growth |
| Frontier Models | 5.3x | 2010-2024 | Top 10 models by compute |
| Language Models | 9.5x | 2017-2024 | Rapid catch-up to frontier |
| LLM Frontier (post-2020) | 5.0x | 2020-2024 | Aligned with overall frontier |
| OpenAI Models | 5x | 2017-2024 | Industry leader pace |
| Google DeepMind | 5x | 2012-2024 | Gemini Ultra: 5e25 FLOP |
📊 Compute Growth Timeline & Projections
Historical Milestones:
- 2020: GPT-3 - 3e23 FLOP
- 2023: GPT-4 - 2e25 FLOP (67x GPT-3)
- 2023: Gemini Ultra - 5e25 FLOP (167x GPT-3)
~5e26 FLOP (current frontier)
💡 In just 5 years, AI models will require nearly 4,000x more compute than today's frontier models.
🏗️ Infrastructure Implications
-
Power Demand Crisis:
43x compute by 2027 requires ~15-20x more power infrastructure than today -
Cooling Challenge:
Advanced liquid cooling essential for next-gen AI clusters running at 40-60kW/rack -
Network Architecture:
Ultra-low latency interconnects critical for distributed training at exascale -
Capital Requirements:
$10B+ investments becoming minimum viable scale for frontier AI infrastructure -
Location Strategy:
500MW+ sites with renewable power access becoming the new standard
💡 Strategic Opportunity for Antriksh Cloud:
The relentless 4-5x annual growth in AI compute creates an insatiable demand for specialized infrastructure. With frontier models today requiring ~5e26 FLOP and projected to need 43x more compute by 2027 and 3,900x by 2030, traditional data centers cannot keep pace.
Key Advantages:
- Massive Underserved Market: Hyperscalers allocate only 3-5% of global AI infrastructure investments to India despite 48% AI adoption rate
- 1.4 Billion Population: World's largest market for AI applications and services
- Purpose-Built Infrastructure: 500MW AI-first facility designed specifically for high-density GPU clusters
- Capturing Unmet Demand: Serving Indian enterprises, startups, and government initiatives currently forced to use inadequate foreign infrastructure
- Cost Advantage: Eliminating expensive overseas compute costs for Indian organizations
- Sovereignty Focus: Addressing data localization requirements and security concerns of Indian organizations
Source: Epoch AI Research, "Training Compute of Frontier AI Models Grows by 4-5x per Year" (2024)
View full analysis →
🌐 Global Data Center Distribution by Country
Key Insight: The world has 11,800 data centers, with the US dominating at 45.6% (5,381 facilities). Top 10 countries control 87.5% of global infrastructure, while India hosts only 1.3% despite being the world's most populous nation.
Global Data Center Distribution by Country

Top 15 Countries by Data Center Count
💡 Strategic Opportunity - The Infrastructure Gap:
The extreme concentration of data centers in developed markets reveals a massive infrastructure gap in emerging economies. India, with 1.4 billion people (17.5% of global population), hosts only 152 data centers (1.3% of global infrastructure). This represents a 13x underinvestment relative to population, creating unprecedented opportunity.
Key Market Insights:
- Massive Underserved Market: India has 94% fewer data centers per capita than the global average
- Digital Economy Boom: India's $250B digital economy growing at 25% annually, requiring massive infrastructure
- AI Adoption Surge: 48% of Indian enterprises actively deploying AI, but forced to use foreign infrastructure
- Data Sovereignty Push: Government mandates for data localization driving domestic infrastructure demand
- Catch-up Potential: To reach global average density, India needs 1,800+ new data centers (12x growth)
Source: Cloudscene, Statista - Global Data Center Statistics (March 2024)
Part 1: Hyperscaler Infrastructure Investment Gap
| Cloud Provider | Global Investment (2023-2025) | India Investment | India's Share | Infrastructure Presence |
|---|---|---|---|---|
| Amazon Web Services | ~$100B annually ($35B Virginia alone by 2040) |
$12.7B by 2030 (~$1.8B/year) |
~2% | Global: 36 regions, 114 AZs India: 2 regions (3rd planned) |
| Microsoft Azure | $80B (FY2025) (50% in US) |
$3B over 2 years ($1.5B/year) |
~2% | Global: 64 regions India: 3 regions (4th in progress) |
| Google Cloud | $75B (2025 CapEx) (Majority for AI/Cloud) |
Undisclosed (Est. <$1B/year) |
<1.5% | Global: 42 regions India: 2 regions |
| Oracle Cloud | Multi-billion globally ($6.5B Malaysia, $8B Japan) |
Undisclosed (High growth rate) |
~4% | Global: 50+ regions India: 2 regions (2 more planned) |
| Meta (AI Infrastructure) | 600,000 H100 GPUs (US-exclusive) |
$0 (No presence) |
0% | AI clusters: US only India: None |
| Chinese Providers (Alibaba, Tencent) |
~$53B (Alibaba) (3-year plan) |
Exiting/Exited (Alibaba closed July 2024) |
0% | Alibaba: Left India Tencent: Minimal presence |
Critical Investment Disparities
Part 2: Emerging GPU Cloud Competition Landscape
Market Opportunity
The massive infrastructure gap created by hyperscaler underinvestment has spawned a new generation of GPU cloud providers. Global leaders like CoreWeave ($23B valuation) and regional champions like E2E Networks are racing to capture the $76B Indian cloud market opportunity by 2030.
| Company | Valuation & Financial Metrics | Revenue & Growth | GPU Infrastructure | Pricing & Market Position | Key Partnerships | Investment Highlights |
|---|---|---|---|---|---|---|
| DECACORNS - Market Leaders ($10B+ Valuation) | ||||||
| CoreWeave $80B |
IPO March 2025: $40/share Current Price: $158-164 IPO Performance: +300% EBITDA Margin: 62% Total Raised: $12B+ |
2024 Revenue: $1.92B 736% YoY Q1 2025: $982M 2025E: $4.9-5.1B 120x growth in 2 years |
250,000+ GPUs H100, H200, GB200 32 DCs, 1.3GW power Target: 500k GPUs by 2026 |
H100: $2.23-4.25/hr 80% below hyperscalers Market Leader OpenAI: $15.9B partnership |
NVIDIA (7% stake) OpenAI ($15.9B deal) Microsoft (62% revenue) Platinum Rating |
IPO: $23B → $80B Best tech IPO 2025 990% CAGR (2022-24) 3,400% Series C returns |
Scale AI $29B |
Valuation Growth: 2019: $1B → 2025: $29B 29x in 6 years Latest: $14.3B by Meta |
Revenue Growth: 2021: $250M → 2025: $2B 8x in 4 years 2024: $870M (130% YoY) |
AI data platform Not GPU infrastructure but key ecosystem player 400+ enterprise clients |
Employee Growth: 900-958 globally Now expanding again |
Partners: US Government,OpenAI, NVIDIA, Meta, Amazon, Self-driving companies |
Growth Highlights: ARR: $1.4B (2024) Gov contracts: $249M+ 162% 2-year CAGR (2021-23) |
| UNICORNS - High Growth Players ($1B+ Valuation) | ||||||
| Lambda Labs $2.5B |
Valuation: $2.5B (Feb 2025) Series: D Total Raised: $933M Revenue Multiple: 5.9x |
2024 ARR: $425M 70% YoY Steady growth trajectory Developer-focused model |
25,000+ GPUs H100, H200, A100 60k H100 capacity InfiniBand clusters |
H100: $2.49/hr Developer-friendly pricing 100,000+ signups NVIDIA Partner of Year 2024 |
NVIDIA (4-year awards) Apple, MIT, DoD Anyscale US Innovation Fund |
Latest: $2.5B valuation Developer ecosystem Consistent growth Hardware + cloud hybrid |
| Together AI $3.3B |
Valuation: $3.3B (2025) Was: $1.25B (2024) Total Raised: $228M+ Revenue Multiple: 25.4x |
2024 ARR: $130M 400% YoY Strong growth continues Platform approach |
Open-source AI platform Model deployment focus Cloud-agnostic Developer tools |
Platform pricing Developer-centric High growth Open-source advantage |
NVIDIA, Salesforce Kleiner Perkins LangChain integration VC backing |
Latest: $3.3B valuation 400% verified growth Continued expansion Strategic value high |
| Crusoe Energy $2.8B |
Valuation: $2.8B Revenue Multiple: 10.2x Total Raised: $1.82B Series: D |
2024 Revenue: $276M 82% YoY Pivoting from crypto to AI 79% growth trajectory |
20,000+ GPUs ordered 1.2GW Texas campus 800,000 GPU target 100% renewable energy |
Competitive pricing 81% below traditional ESG Leader Stranded energy model |
NVIDIA investor Databricks, Sony Fortune 100 tenant Together AI |
IPO: $5-7B range Climate-aligned compute Unique energy arbitrage $3.4B JV announced |
| FluidStack TBD |
Valuation: In Series A talks Total Raised: $3-4.5M only Status: $200M round discussions Capital efficient |
2024 ARR: $180M 620% YoY From $2M → $23M → $180M EBITDA positive |
Dual model platform Marketplace + private cloud Aggregated capacity Asset-light approach |
Competitive rates Marketplace model Highest Growth Rate Minimal dilution |
Character.AI Mistral AI Marquee AI startups Strategic partners |
620% Growth EBITDA positive Valuation pending Acquisition target |
| Voltage Park $1B invested |
Structure: Nonprofit Investment: $1B Funding: Navigation Fund Zero debt model |
Revenue not disclosed Nonprofit structure Mission-driven Below-market pricing |
24,000 H100 GPUs 8,176 GPU clusters 6 US locations H200/Blackwell coming |
H100: $2.25/hr Lowest pricing Exchange-based model Democratizing AI |
Jed McCaleb (founder) Imbue, Character.ai Research community Open access focus |
Disrupting on price $500M GPU purchase Market maker model Social impact angle |
| INDIAN MARKET LEADERS - Regional Champions | ||||||
| E2E Networks ~$72M |
Market Cap: ~$72M (₹5,989 Cr) Listed: NSE Stock Growth: 93-112% YoY Public market play |
Revenue: ₹164Cr 93-112% growth 15,000+ customers Breaking even |
~600 GPUs estimated H200, H100, A100 First H200 in India 2 data centers |
H100: $3/hr reserved Contract-less cloud India Leader 50-70% cost savings |
NVIDIA Elite Partner Zomato, Nykaa IITs, startups MeitY empaneled |
Strong growth 99.99% uptime Established player Expansion to USA |
| Adani Connex $14B commitment |
Structure: 50-50 JV Debt Raised: $1.44B Total Commit: $14B (est.) Conglomerate backing |
Revenue undisclosed Build-to-suit model $10B market opportunity Infrastructure play |
GPU-ready infrastructure 1-1.5 GW capacity 6 cities operational 10 GW vision |
Enterprise pricing Colocation focus 100% renewable $6.60/watt construction |
EdgeConneX (JV) Google, Microsoft, AWS State governments Hyperscaler focus |
Adani ecosystem Green data centers Submarine cable access Scale advantage |
| Yotta/Shakti Hiranandani |
Backing: Hiranandani Group Structure: Corporate Investment: Undisclosed DGX Cloud partner |
Enterprise revenues Premium pricing Government contracts AI Lab model |
16,384 H100 GPUs Mumbai supercluster Tier IV DC Largest in India |
Enterprise pricing AI Lab access Largest GPU cluster in India |
NVIDIA DGX Cloud Lepton marketplace Enterprise clients Government projects |
Scale leadership Premium positioning Corporate backing Infrastructure focus |
| EMERGING PLAYERS - High Growth Potential | ||||||
| Neysa Series A |
Raised: $50M total Series A: $30M (Oct 2024) Investors: NTTVC, Z47 Breaking even by 2025 |
12 paying customers Early revenue stage High growth Platform approach |
Thousands of GPUs 25k cluster planned H100, H200, L40S Mumbai + Hyderabad |
H100: $2.50/hr 40-70% below global Open-source platform No vendor lock-in |
NTT (investor) Telangana Govt NVIDIA partnership Startup credits program |
Premium positioning International expansion Framework integration VC-backed growth |
| Rackbank ~$120M |
Raised: ₹1,000 Cr Valuation: ~$104M Backing: Government Q4 2024 launch |
Pre-revenue Q3 2025 full capacity Government contracts AI factory model |
60,000 GPUs planned 80MW campus 100k GPU capacity Blackwell-ready |
Government rates 30% cost savings Varuna cooling 70% energy savings |
State governments Chhattisgarh SEZ MP incentives NVIDIA ready |
World's largest AI DC Liquid cooling leader Government backing Q3 2025 catalyst |
| NxtGen Legacy Player |
Raised: $37.7M Last Round: 2015 Status: Active IndiaAI provider |
1,000+ organizations Government contracts Multi-vendor strategy National AI portal |
18k GPU national pool 12k GPUs by 2025 55% NVIDIA, 43% AMD 10 new DCs planned |
Subsidized: $1.7/hr Commercial: $2.5-3/hr Diamond cooling 80kW rack density |
MeitY (IndiaAI) Red Hat OpenShift Intel Capital Government focus |
Energy efficiency leader Multi-vendor advantage 400 AI engineers hiring 10-15x cost advantage |
| Rescale ~$800M-1.2B |
Valuation: $800M-1.2B range Revenue Multiple: 8-12x Total Raised: $260-369M Series D stage |
Revenue: $36-75M range Enterprise HPC focus 400+ customers Steady growth |
Cloud orchestration Not GPU owner Multi-cloud platform Enterprise focus |
SaaS pricing model Enterprise contracts Long sales cycles Premium positioning |
AWS, Azure, GCP Enterprise clients HPC community Strategic partners |
IPO or acquisition likely Asset-light model 40-45% IRR history Marathon growth |
Unit Economics
1MW AI GPU Data Center - NVIDIA Blackwell GB200 NVL72 Configuration
Key Investor Metrics - Optimized Case
Executive Summary - Per MW Metrics
This comprehensive analysis presents the verified unit economics for a 1MW AI GPU data center deploying NVIDIA GB200 NVL72 systems with optimized CAPEX approach:
- CAPEX per MW: $34.4 million (11% reduction through optimization)
- Revenue per MW: $15-21 million annually at 80-85% utilization
- GPUs per MW: 576 NVIDIA B200 GPUs (8 NVL72 racks)
- Compute per MW: 11.52 ExaFLOPS (FP8 precision)
- IRR: 46% unlevered, 65% levered (60% debt financing)
- Payback Period: 2.4 years (levered)
- EBITDA Margin: 66-68% at maturity
- Net Margin: 28-35% after tax
Revenue to Net Income Flow
1. Infrastructure Configuration - Per MW Deployment
NVIDIA GB200 NVL72 Specifications
| Specification | Per Rack | Per MW (8 Racks) |
|---|---|---|
| System Architecture | 36 Grace CPUs + 72 B200 GPUs | 288 CPUs + 576 GPUs |
| Power Consumption | 120kW (verified actual draw) | 960kW IT load |
| Cooling Requirements | Direct-to-chip liquid (mandatory) | 1.15MW total facility power |
| AI Performance | 1.44 ExaFLOPS (FP8) | 11.52 EFLOPS per MW |
| Memory | 13.8TB HBM3e (192GB/GPU) | 110.4TB total memory |
| Interconnect | NVLink + InfiniBand | Full mesh connectivity |
1MW Data Center Key Metrics
2. Capital Expenditure (CAPEX) Breakdown - Optimized Approach
Hardware Investment
| Component | Quantity | Unit Cost | Total Cost | Notes |
|---|---|---|---|---|
| GB200 NVL72 Systems | 8 racks | $3.0M | $24.0M | List price |
| Volume Discount | - | -10% | -$2.4M | Bulk purchase |
| Network Infrastructure | - | - | $1.2M | InfiniBand, switches |
| Storage Systems | - | - | $0.8M | High-speed NVMe |
| Hardware Subtotal | $23.6M | $23.6M/MW |
Infrastructure Investment (Optimized)
| Component | Optimized Cost | Savings Strategy | Specifications |
|---|---|---|---|
| Building & Civil Works | $1.6M | Local construction, modular design | 15,000 sq ft, Tier III design |
| Power Infrastructure | $1.8M | Local vendors, standardized components | 2N redundancy, 2MVA capacity |
| Liquid Cooling System | $2.0M | Proven designs, bulk procurement | Direct-to-chip, N+1 redundancy |
| Fire & Security | $0.4M | Integrated systems | VESDA, biometric access |
| Infrastructure Subtotal | $5.8M | 36% savings vs base | $5.8M/MW |
Soft Costs & Contingency (Optimized)
| Component | Optimized Cost | Optimization Method | Timeline |
|---|---|---|---|
| Design & Engineering | $0.8M | Proven reference designs | 3 months |
| Permits & Compliance | $0.4M | Streamlined process | 2 months |
| Project Management | $0.5M | Local PM team | 18 months |
| Working Capital | $1.2M | 2 months operations | - |
| Contingency | $2.1M | 5% (reduced from 10%) | - |
| Soft Costs Subtotal | $5.0M | 33% savings vs base | $5.0M/MW |
3. Operating Expenditure (OPEX) Analysis - Per MW
Annual Operating Costs (Year 3 - Stabilized)
| Category | Annual Cost per MW | % of Revenue | Key Assumptions |
|---|---|---|---|
| Power & Utilities | $1.26M/MW | 7.9% | $0.15/kWh, 80% average load |
| Cooling Operations | $0.32M/MW | 2.0% | $40K/rack/year maintenance |
| Staffing | $0.28M/MW | 1.8% | 15 FTEs per MW |
| Hardware Maintenance | $2.36M/MW | 14.8% | 10% of hardware value |
| Network & Connectivity | $0.18M/MW | 1.1% | Redundant 10Gbps links |
| Insurance & Compliance | $0.34M/MW | 2.1% | 1% of asset value |
| Facility Lease | $0.36M/MW | 2.3% | Prime tech hub location |
| Other Operating | $0.25M/MW | 1.6% | Supplies, utilities |
| TOTAL ANNUAL OPEX | $5.35M/MW | 33.5% | At 80% utilization |
4. Revenue Model & Projections - Per MW
Service Mix & Pricing Strategy
AI Infrastructure as a Service (70% of revenue)
| Service Type | Price/GPU-hour | Monthly Rev per MW | Annual Rev per MW | Market Position |
|---|---|---|---|---|
| On-Demand | $5.00 | $2.07M @ 100% | $24.8M/MW | 20% below US rates |
| Reserved 1-Year | $4.00 | $1.66M @ 100% | $19.9M/MW | 20% discount |
| Reserved 3-Year | $3.20 | $1.33M @ 100% | $15.9M/MW | 36% discount |
| Spot Instances | $2.50 | $1.04M @ 100% | $12.4M/MW | 50% discount |
GenAI Inference Services (25% of revenue)
| Model Complexity | Price/Million Tokens | Tokens/sec per GPU | Use Cases |
|---|---|---|---|
| Small (7B params) | $0.10 | 15,000 | Chatbots, simple tasks |
| Medium (13-70B) | $1.00 | 8,000 | Content generation |
| Large (175B+) | $5.00 | 2,000 | Complex reasoning |
| Custom Fine-tuned | $10.00 | Varies | Enterprise specific |
Platform Services (5% of revenue)
- Managed Kubernetes: $300/GPU/month = $173K/MW/month
- MLOps Platform: $200/GPU/month = $115K/MW/month
- Professional Services: $200/hour (dedicated team per MW)
Revenue Projections by Year - Per MW Basis
| Year | Utilization | IaaS Revenue | Inference Revenue | Platform Revenue | Total Revenue | Rev per MW |
|---|---|---|---|---|---|---|
| 1 | 60% | $8.4M | $3.0M | $0.6M | $12.0M | $12.0M/MW |
| 2 | 70% | $9.8M | $3.5M | $0.7M | $14.0M | $14.0M/MW |
| 3 | 80% | $11.2M | $4.0M | $0.8M | $16.0M | $16.0M/MW |
| 4 | 85% | $11.9M | $4.3M | $0.8M | $17.0M | $17.0M/MW |
| 5 | 85% | $12.6M | $4.5M | $0.9M | $18.0M | $18.0M/MW |
*Assumes 2% annual price increases for inflation adjustment
5. Financial Performance Metrics - Per MW
Profitability Analysis
✓ Higher EBITDA margins justified by: GB200 efficiency (30% lower power), scale advantages (576 GPUs), lean operations (38 GPUs/employee), and premium pricing for 4x/30x performance gains
| Metric | Year 1 | Year 2 | Year 3 | Year 4 | Year 5 |
|---|---|---|---|---|---|
| Revenue per MW | $12.0M | $14.0M | $16.0M | $17.0M | $18.0M |
| OPEX per MW | $4.7M | $4.9M | $5.35M | $5.5M | $5.7M |
| EBITDA per MW | $7.3M | $9.1M | $10.65M | $11.5M | $12.3M |
| EBITDA Margin | 61% | 65% | 66% | 68% | 68% |
| Depreciation (5yr) | $4.72M | $4.72M | $4.72M | $4.72M | $4.72M |
| EBIT per MW | $2.58M | $4.38M | $5.93M | $6.78M | $7.58M |
| Interest (60% debt @ 9%) | $1.86M | $1.67M | $1.49M | $1.30M | $1.12M |
| Pre-tax Income | $0.72M | $2.71M | $4.44M | $5.48M | $6.46M |
| Tax (25%) | $0.18M | $0.68M | $1.11M | $1.37M | $1.62M |
| Net Income per MW | $0.54M | $2.03M | $3.33M | $4.11M | $4.84M |
| Net Margin | 5% | 15% | 21% | 24% | 27% |
Key Investment Metrics - Per MW
6. Monte Carlo Simulation Results
Simulation Parameters (10,000 iterations)
- Utilization: Normal distribution (μ=75%, σ=10%)
- GPU Pricing: Triangular ($3.50, $4.50, $5.50)
- CAPEX Variance: ±15% uniform distribution
Results Distribution - Per MW
| Metric | P10 | P25 | P50 (Median) | P75 | P90 | Mean |
|---|---|---|---|---|---|---|
| 5-Year NPV per MW | $7.5M | $12.3M | $17.1M | $21.9M | $26.7M | $17.3M |
| IRR (%) | 36% | 51% | 65% | 79% | 93% | 65% |
| Payback (years) | 3.3 | 2.9 | 2.4 | 2.0 | 1.7 | 2.4 |
| Year 3 EBITDA Margin | 58% | 62% | 66% | 70% | 73% | 66% |
Probability Analysis
7. Sensitivity Analysis - Impact per MW
Impact on NPV (Tornado Chart)
| Variable | -20% Change | Base Case | +20% Change | Range Impact |
|---|---|---|---|---|
| GPU Pricing | $6.8M/MW | $17.1M/MW | $27.4M/MW | $20.6M range |
| Utilization | $8.5M/MW | $17.1M/MW | $25.7M/MW | $17.2M range |
| CAPEX | $21.2M/MW | $17.1M/MW | $13.0M/MW | $8.2M range |
| Operating Costs | $20.5M/MW | $17.1M/MW | $13.7M/MW | $6.8M range |
| Power Costs | $18.8M/MW | $17.1M/MW | $15.4M/MW | $3.4M range |
Impact on IRR (5-year) - Detailed Sensitivity
| Variable | -20% | -10% | Base (65%) | +10% | +20% |
|---|---|---|---|---|---|
| GPU Pricing | 33% | 49% | 65% | 81% | 97% |
| Utilization | 26% | 46% | 65% | 84% | 103% |
| OpEx | 71% | 68% | 65% | 62% | 59% |
| CapEx | 53% | 59% | 65% | 72% | 80% |
Note: Optimized CAPEX approach improves IRR sensitivity - base case now 65% vs 58% original
8. Risk Analysis & Mitigation
Risk Matrix
| Risk Factor | Probability | Impact | Mitigation Strategy |
|---|---|---|---|
| Low Utilization | Medium | High | • Anchor tenant contracts (40% pre-committed) • Aggressive marketing • Competitive pricing vs global providers |
| Technology Refresh | High | Medium | • 3-year refresh cycle planned • Modular architecture for easy upgrades • NVIDIA trade-in programs |
| Competition | Medium | Medium | • First-mover advantage in region • Superior 99.99% SLA commitment • Local support advantage |
| Power Disruption | Low | High | • 2N power redundancy design • Dual grid connections • 48-hour diesel backup |
| Regulatory Changes | Low | Medium | • Government partnership discussions • Full compliance framework • Legal reserves allocated |
9. Benchmarking Analysis - Industry Comparison
Performance Metrics vs Industry Leaders
| Metric | This Project | CoreWeave | Lambda Labs | Industry Avg |
|---|---|---|---|---|
| EBITDA Margin (Y3) | 66% | ~45% | ~38% | 35-45% |
| Revenue Multiple | 2.2x | 12x | 4.2x | 5-7x |
| CAPEX/MW | $34.4M | ~$25M* | ~$20M* | $20-30M |
| GPU Utilization | 80% | 75-80% | 70-75% | 60-70% |
| PUE | 1.20 | 1.25-1.30 | 1.30-1.35 | 1.40-1.50 |
| Revenue per MW | $16M | ~$14M | ~$12M | $10-15M |
| Technology | GB200 (Latest) | H100/A100 | H100 | Mixed Gen |
*Note: Competitor CAPEX figures based on older GPU generations (H100/A100). GB200's $34.4M/MW includes cutting-edge liquid cooling and higher power density. The 15% premium over competitors is justified by 4x training and 30x inference performance improvements, resulting in superior revenue per MW.
Competitive Advantages Summary
Superior Unit Economics
- 21% higher EBITDA margin than CoreWeave
- 28% higher revenue per MW vs industry average
- Latest GB200 technology (competitors on H100)
- Industry-leading PUE of 1.20
Valuation Opportunity
- Trading at 2.2x revenue vs 5-7x industry
- Significant multiple expansion potential
- Exit valuation could reach $80-112M (5-7x)
- Strategic value to hyperscalers
10. Market Opportunity & Competitive Position
Market Analysis
- AI Market Size: $7.8B by 2025 (38.1% CAGR)
- GPU Cloud Market: $2.5B addressable market
- Data Center Growth: 956MW capacity addition by 2026
- Government Initiative: National AI Mission with $1.2B allocation
- Cost per MW: 40-50% lower than US/Europe facilities
Per MW Competitive Advantages
- Latest Technology: 11.52 EFLOPS per MW
- Cost Leadership: $5.35M OPEX per MW
- Energy Efficiency: PUE 1.20 vs 1.50 average
- Scalability: Modular MW-based expansion
- Revenue per MW: $16-18M at maturity
11. Investment Structure
Optimal Capital Structure - Per MW
| Source | Amount per MW | Percentage | Terms |
|---|---|---|---|
| Equity | $13.8M/MW | 40% | Strategic investors, founders |
| Senior Debt | $17.2M/MW | 50% | @ 9% interest, 5-year term |
| Vendor Financing | $3.4M/MW | 10% | NVIDIA financing, 3-year |
| Total per MW | $34.4M/MW | 100% |
Exit Strategy Options (Years 3-5)
- Strategic Sale: To hyperscalers at 8-10x EBITDA ($85-106M per MW)
- PE/Infrastructure Fund: Sale at 12-15x cash flow multiple
- IPO/InvIT Listing: After scaling to 50MW+ across multiple locations
- Continued Operations: Generate $3.3-4.8M net income per MW annually
Investment Conclusion - Unit Economics per MW
The GB200 NVL72 data center presents exceptional unit economics with optimized capital structure:
- Investment per MW: $34.4M CAPEX (optimized approach)
- Revenue per MW: $16-18M annually at maturity
- EBITDA per MW: $10.7-12.3M (66-68% margin)
- Returns: 46-65% IRR with 2.4 year payback
- Infrastructure Efficiency: 576 GPUs and 11.52 EFLOPS per MW
- Scalability: Proven model can replicate across multiple MW deployments
The combination of cutting-edge GB200 technology, optimized CAPEX approach, and strong operational metrics creates an exceptional opportunity for investors seeking exposure to the AI infrastructure boom.
Unit economics validated at $34.4M investment per MW generating $16-18M revenue per MW
Disclaimer: All financial projections are based on current market conditions and optimized cost assumptions. Actual results will vary based on final negotiated costs, execution quality, and market dynamics. This report is for informational purposes only.
🚀 Fast-Track Development Timeline
📦 Phase 0: Quick Start
3MW Container PoC
Live in 6-8 months
Immediate revenue generation while building at scale
🏗️ Phase 1: Scale Up
100MW Building
Live in 18 months
Full-scale facility with enterprise infrastructure
🎯 5-Year Vision
500MW Campus
Phased expansion
Regional AI infrastructure hub
⚡ Parallel Execution Strategy
Timeline starts from MoU signing | All phases designed for independent operation and revenue generation
📊 Visual Timeline Overview
| Phase | Year 1 | Year 2 | Year 3 | Year 4 | Capacity | Revenue |
|---|---|---|---|---|---|---|
| Pre-Development |
Q1-Q2
|
- | - | - | - | - |
| Phase 0: PoC |
Q1
|
- | - | - | 3MW | $4-5M |
| Phase 1 |
Q3-Q4
|
Q1-Q2
|
- | - | 100MW | $150-180M |
| Phase 2 | - |
Q3-Q4
|
Q1
|
- | 200MW | $300-360M |
| Phase 3 | - | - |
Q1-Q3
|
- | 300MW | $450-540M |
| Phase 4 | - | - | - |
Q1-Q3
|
400MW | $600-720M |
| Phase 5 | - | - | - |
Q3-Q4
|
500MW | $750-900M |
* Timeline assumes favorable regulatory environment and successful execution of parallel activities
📊 Detailed Gantt Chart - Initial Phases (Months 0-24)
Fast-Track Development Schedule from MoU Signing
🎯 Key Achievements by Month 7
- 3MW PoC operational generating revenue
- Land acquired and master plan approved
- Environmental clearances obtained
- Power allocation secured
⚡ Parallel Execution Strategy
- Multiple workstreams running concurrently
- Early revenue from containerized deployment
- De-risked approach with phased validation
- 30% faster than traditional sequential approach
SWOT Analysis Matrix
Strengths
-
India's Sovereign AI Infrastructure Leader500MW capacity positions Antriksh as India's answer to global AI dominance, ensuring data sovereignty and reducing dependence on foreign cloud providers for critical AI workloads
-
Strategic Delhi NCR Location Strategic AssetProximity to government agencies, defense establishments, and major enterprises in the capital region enables low-latency access for sovereign AI applications and rapid policy alignment
-
Renewable Hydropower IntegrationCommitted to hydroelectric power sourcing providing stable long-term energy costs, ESG compliance, and insulation from fossil fuel volatility - attracting green financing at lower rates
-
No Data Egress Fees + India Cost Leadership40-50% TCO advantage combining $0.08/kWh power, 67% lower labor costs, and zero egress fees - delivering unmatched economics for price-sensitive Indian enterprises
Weaknesses
-
Capital Intensity (Mitigated by Phasing) Medium$12-14B investment addressed through smart phasing - initial 100MW requires only $2B with revenue generation from Month 3, reducing investor risk significantly
-
Delhi NCR Climate Challenges LowExtreme summer heat (45-50°C) requires robust cooling - addressed through cutting-edge liquid immersion technology reducing cooling costs by 40% vs traditional methods
-
Initial Brand Building Phase LowNew entrant status offset by strategic government partnerships, IndiaAI alignment, and world-class infrastructure that will quickly establish credibility
-
GPU Supply Dependencies MediumNVIDIA reliance mitigated through multi-vendor strategy (AMD, Intel partnerships) and India's strategic importance ensuring priority allocation
Opportunities
-
India's AI Sovereignty Imperative National PriorityGovernment mandate to reduce foreign cloud dependence for critical AI workloads - Antriksh positioned as the national champion for sovereign AI infrastructure
-
First-Mover in North India AI EcosystemDelhi NCR relatively underserved vs Mumbai/Bangalore - opportunity to become the flagship AI compute hub for government, defense, and North Indian enterprises
-
China-Plus-One Geopolitical AdvantageIndia as trusted democracy attracts global AI workloads avoiding China - Western nations prefer India for sensitive AI deployments with full access to latest chips
-
Green Financing BonanzaAccess to $1.4B+ sustainability-linked financing at preferential rates (following AdaniConneX model) - hydropower focus unlocks green bonds and ESG funds
Threats
-
Hyperscaler Competition (Mitigated by Sovereignty) MediumAWS/Azure/GCP expansion offset by Indian data localization requirements and government preference for domestic infrastructure for sensitive workloads
-
Multiple Domestic Players Entering MediumAdaniConneX, Reliance Jio building capacity - but none match Antriksh's 500MW scale, North India focus, and sovereign positioning
-
Global GPU Supply Constraints MediumChip shortages real but India's strategic importance and government backing ensure priority allocation - plus multi-vendor strategy reduces risk
-
Climate Change Impact on Operations LowRising temperatures and water stress in Delhi NCR - proactively addressed through advanced liquid cooling and water recycling systems
🎯 Strategic Action Plan
💡 Leverage Strengths
- Position as India's sovereign AI infrastructure
- Fast-track government and defense contracts
- Secure green financing at preferential rates
- Market Delhi NCR strategic location benefits
- Showcase 500MW scale for priority GPU allocation
🔧 Address Weaknesses
- Phased rollout to minimize capital risk
- Deploy advanced liquid cooling for Delhi heat
- Hire global data center veterans
- Leverage single-window government clearances
- Build credibility through IndiaAI partnership
🚀 Capture Opportunities
- Lock in defense and government contracts
- Become North India's AI infrastructure hub
- Attract China-plus-one global workloads
- Access sustainability-linked financing
- Target enterprises fleeing egress fees
🛡️ Mitigate Threats
- Emphasize data sovereignty requirements
- Secure multi-vendor GPU agreements
- Build military-grade security systems
- Create government revenue base for stability
- Deploy climate-resilient infrastructure
⚡ Risk Assessment & Mitigation
🔴 Manageable Priority Risks
- • Capital Requirements: Phased approach reduces to $2B initial need
- • GPU Supply: Government backing ensures priority allocation
- • Competition: Sovereign positioning creates defensible moat
🟡 Well-Controlled Risks
- • Delhi Climate: Advanced liquid cooling solves heat challenges
- • Execution Complexity: Phased rollout with proven partners
- • Market Timing: First-mover advantage in North India
🟢 Minimal Risk Factors
- • Regulatory: Fast-track approvals for national projects
- • Revenue Certainty: Government contracts provide base
- • Technology: Modular design enables upgrades
Risk Mitigation Excellence
Every identified risk has clear mitigation strategies backed by India's sovereign infrastructure needs. Government support, strategic location advantages, and phased deployment create multiple layers of protection for investor capital while maintaining aggressive growth potential.
🇮🇳 India's Strategic AI Infrastructure Asset
Why This Matters: India cannot depend on foreign hyperscalers for critical AI workloads in defense, government services, financial systems, and strategic research. Antriksh Cloud provides the sovereign infrastructure that ensures India's AI capabilities remain under Indian control - a national imperative that creates an extraordinary investment opportunity with government-backed demand and premium valuations.
❓ Frequently Asked Questions
Get answers to common questions about Antriksh Cloud's AI infrastructure services
Laser-focused on AI workloads only. We are not a general-purpose cloud; every rupee, rack, and process is optimised for modern AI training and inference in India.
| Others … | Antriksh Cloud |
|---|---|
| Blend AI with web-hosting & generic VMs | 500 MW campus reserved 100 % for Agentic AI and AI compute—no other workloads |
| Air-cooled racks that throttle under sustained load | Liquid direct-to-chip cooling → PUE < 1.2 and up to 15 % more usable FLOPs |
| Regions outside India (latency > 80 ms) or exposed to US CLOUD Act | Strategic site → 5–30 ms nationwide, full data-sovereignty, state green-power subsidies |
| One-price-fits-all, USD billing, hidden egress fees | INR billing, 30–40 % cheaper ₹/GPU-hour, zero egress; tiers tuned to Indian AI-startup budgets |
- Better ₹-per-FLOP economics – latest GPUs + liquid cooling maximise compute for every rupee.
- Regulatory peace-of-mind – data, keys, and logs never leave Indian jurisdiction.
- Rapid time-to-GPU – containerised 3 MW pods can be live ≈ 6 months after purchase order.
Bottom line: If your workload isn’t AI, we’re not your cloud. If it is - nobody in India can match our cost, latency, sustainability, or sovereignty guarantees at this scale.
GPU portfolio (launch sequence)
- Blackwell + family (GB200 and future refreshes)
- AMD MI350X clusters for cost-optimised training
- Cerebras CS-3 wafer-scale engines for ultra-large models
- Groq LPUs for sub-10 ms, high-throughput inference
Evolving rack densities – pods start at 150 kW and are engineered to scale to 300 kW and 600 kW per rack as chip TDPs climb.
Pricing models
- On-demand ₹/GPU-hour or month-to-month rental
- Reserved instances (1-3 yr) with up to 50 % discount
- Dedicated enterprise clusters billed at cluster size rate
- Pay-per-API-call for managed inference endpoints
Security and sovereignty are built in from day one:
- Certifications – SOC 2 Type II, ISO 27001 / 27017 / 27701, and continuous DPDP Act 2023 audits.
- Always-on protection – 24 × 7 SIEM monitoring, zero-trust IAM, full-volume and in-flight AES-256 encryption, HSM-backed key management.
- Enterprise sandboxing – every tenant runs in a logically isolated VPC with private subnets, dedicated GPU pools, and policy-based egress controls.
- Defence-grade segregation – national-security workloads are housed in a physically separate, air-gapped building tied directly to classified defence networks and staffed by cleared personnel.
- Sovereign safeguards – data, logs, and keys never leave India; change-of-control clauses lock infrastructure to Indian jurisdiction.
- Compliance reporting – real-time audit dashboards plus quarterly third-party penetration tests, with attestation reports available under NDA.
Result: Whether you are a start-up, a listed enterprise, or a defence agency, your workloads stay isolated, encrypted, and fully compliant—today and as regulations evolve.
Minutes for experiments, hours for production.
- Self-service portal – spin up a single-node notebook or multi-GPU job in < 15 minutes.
- Pre-baked ML images – PyTorch, TensorFlow, JAX, and CUDA optimised kernels are one click away.
- Custom enterprise clusters – delivered in 24-48 hours with VPC peering, private subnets, and policy-based egress controls.
- Code-level API – request, monitor, and tear down GPU pools programmatically (see example in the next answer).
Result: you can move from “idea” to “training run” the same day—no GPU waitlists, no long procurement cycles.
Yes—Antriksh Cloud plugs into any cloud or on-prem stack.
- Native peering & VPN options for AWS, Azure, GCP, OCI, and on-prem DCs.
- API marketplace – REST & Python SDKs for workload scheduling, data migration, and cost optimisation across clouds.
- Code-level access – request GPUs in one line:
                        from antriksh.cloud import Cluster

                        # Create an 8-GPU GB200 server in 'delhi-1' region
                        cluster = Cluster(region="delhi-1")
                        job = cluster.request(
                            gpus=8,
                            gpu_type="GB200",
                            duration="24h",            # on-demand
                            storage="2TB_NVMe",
                            network="100G_InfiniBand"
                        )
                        print("Job ID:", job.id)
- Kubernetes-ready – use our CSI & CNI plugins to burst pods to Antriksh while keeping control-plane on your primary cloud.
- Unified billing – single invoice in INR even when workloads span multiple providers.
Bring data from anywhere, burst massive AI jobs to our GPU fabric, and return results—without lock-in.
We combine predictive software and modular hardware to keep queue wait-times under five minutes—even on launch-day spikes.
- Elastic GPU pools : Kubernetes + Slurm control plane can burst spare GPUs across adjacent racks in < 30 s; autoscaler pre-allocates capacity as queue depth grows.
- Tiered job queues :
- On-demand (interruptible / non-interruptible)
- Reserved (guaranteed start window)
- Priority (24 × 7 latency-critical inference)
- Hot-swap containers : GPU “blade” modules (96–192 kW) let us inject or remove 512–1,024 GPUs at a time without touching core power-or-cooling loops.
- Predictive scaling : Prometheus telemetry feeds a Prophet model that forecasts demand two hours ahead; idle pods are shut down or released to the spot pool.
- Multi-chip flexibility : If NVIDIA inventory tightens, the scheduler transparently routes compatible workloads to AMD MI300X or Groq LPUs, keeping queue wait < 5 min.
- Reserved-capacity SLAs : Enterprise contracts include “GPU credits” that guarantee burst rights during peak events—backed by a 10 % service-credit penalty for any miss.
Sub-50 ms latency nationwide, backed by multi-terabit dark fibre.
- Feasibility complete : end-to-end fibre routes surveyed with five independent carriers already present in the region.
- Tri-path redundancy : dual dark-fibre paths to neutral IXPs in Mumbai & Delhi NCR, plus a third east-bound path for disaster resilience.
- Massive headroom : initial order of 1.6 Tbps of dedicated bandwidth (four 400 G channels) split across at least three providers.
- Metro ring integration : 400 G leaf-spine fabric ties directly into India’s top metro markets, sustaining < 50 ms RTT even under failover.
- Carrier-agnostic cross-connects : single-mode and multi-mode options inside the data-centre meet-me room for tenant direct connects, Wave, MPLS or Internet transit.
- Jumbo frame & RDMA-ready : 100 G/400 G InfiniBand gateways ensure low-latency east-west traffic for distributed training jobs.
Result: AI workloads reach users and other clouds in milliseconds, with no single carrier dependency and ample future bandwidth.
Five complementary revenue streams power our business:
- GPU Infrastructure-as-a-Service (IaaS) – on-demand and reserved GPU hours for training workloads (≈ 50 %)
- AI Platform-as-a-Service (PaaS) – managed training pipelines, low-latency inference, vector DBs, RAG tooling, and MLOps (≈ 20 %)
- Defence & Government Cloud – air-gapped, sovereign clusters on long-term contracts with national-security agencies (≈ 15 %)
- Venture Compute – we allocate otherwise idle, off-peak GPU capacity to promising AI start-ups at a steep discount in exchange for equity stakes (≈ 5 %)
- AI-Ops & Compliance Add-ons – audit logging, model observability, policy enforcement, and premium support subscriptions (≈ 10 %)
These streams blend usage-based revenue with sticky subscriptions, turning idle capacity into equity upside while keeping cash flow predictable.
• Draft MoU with renewable-power and incentives
• Engineering design for 3 MW PoC pod
Seed-Infra round: US $66 million
- 64 %: 3 MW Proof-of-Concept (PoC) capex, incl. GPUs and liquid-cooling modules
- 20 %: Land acquisition with a multi year payment plan, permits, and state-incentive obligations
- 10 %: working capital & early operations
- 6 %: contingency reserve
This capital turns the PoC live and revenue-generating—creating an optional early exit for investors—yet our plan is to scale the campus ourselves.
Next phase of capital: scale from 3 MW to the first 100 MW GPU cluster once PoC revenues and metrics are proven.
📝 Have a Question?
Submit your question below and our team will respond within 24-48 hours.
Loading question form...
Files & Resources
All project documentation, appendices, and external resources in one place
Quick Navigation
About Us
Founder's Profile
Team
Meet our world-class team driving cloud innovation in India
Vision & Mission
Building India's sovereign AI infrastructure for the future
Market Analysis
List of Projects
Timelines of Similar Projects
AI Infrastructure Market Analysis
In-depth analysis of market opportunities and competitive landscape
AI & Cloud Growth
Analysis
Investment Growth Metrics
Analysis
AI Infrastructure Startups
Analysis
How the U.S. CLOUD Act Undermines India’s Sovereignty
Deep Research Report
The Rise of Venture Compute
Deep Research Report
TAM, SAM, and SOM Overview
Deep Research Report
Infrastructure is Destiny
OpenAI Report
Infrastructure is Destiny
OpenAI Comments
On Infrastructure Sovereignity
US Export Restrictions Lifted
Regulation
Industry Reports
McKinsey Quarterly Report
The cost of compute: A $7 trillion race to scale data centers 2025
McKinsey Report
AI power: Expanding data center capacity to meet growing demand
JLL Report 2025
Global Data Center Outlook
JLL Report
India: The new frontier for AI GPU clusters
Goldman Sachs Report
Strategic Market Assessment
Cushman & Wakefield Report
Global Data Center Landscape 2025
DCByte Report
Data Center Index 2024
Future Megatrends
Visual analysis of emerging $1T+ industries reshaping the global economy